QuakeLive
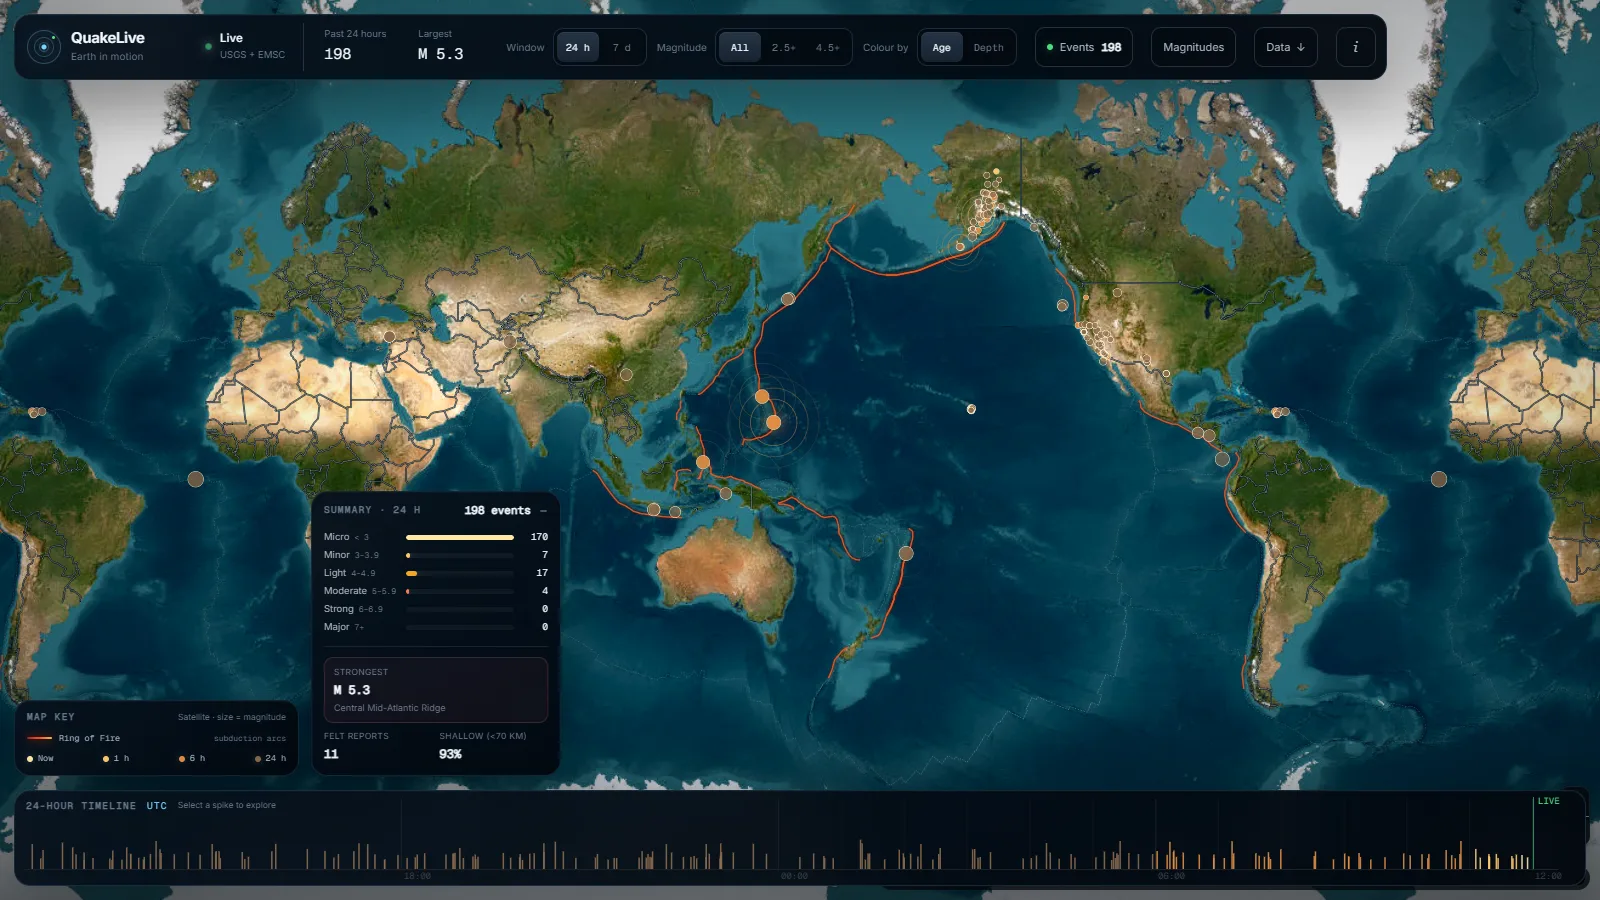
A live earthquake explorer in the browser: plain-language summaries and the full technical record.
- Live feeds
- USGS polled every minute, merged with EMSC real-time push
- Catalogue
- Back to about 1900, exported to CSV
- Research export
- 18 CSV columns
- Backend
- None. No account, no API key
- Licence
- MIT, open source
Problem
A magnitude and a place name tell you little about what happened. The detail exists, but it is spread across agencies and written for specialists.
I wanted one page that explains an earthquake in plain language first, and then shows the full technical record behind it.
Data and physics
Events come from the USGS feed, polled every minute, and from the EMSC real-time WebSocket. The two are merged into one list.
Focal mechanisms come from published moment tensors, with a multi-agency comparison that includes Global CMT. Waveforms come from the nearest open EarthScope (IRIS FDSN) station. The catalogue is the full USGS record back to about 1900.
Method
Each beachball is computed per pixel from the published moment tensor (the P-wave radiation sign, drawn lower-hemisphere equal-area) and checked against the USGS T, P and N axes. It is not clip art.
For the seismogram I take the vertical channel of the nearest station and overlay the iasp91 predicted P and S arrivals together with the real USGS analyst pick, so the timing residual is visible. The timeline, seismogram and beachball are hand-drawn canvas.
Result
QuakeLive is live and open source under the MIT licence. It is a static single-page app: the browser talks straight to the public data sources.
Waveforms export to CSV with a metadata header, plus PNG, and the research export has 18 columns. It is informational only and is not a warning service.
Built with: React 19 · TypeScript · Vite · MapLibre GL · Zustand · Tailwind CSS 4 · Live app · GitHub